- Meeting Tips
- Using Less Meeting
Meeting KPIs: Which Metrics to Track and How
By Blake Byrnes

Photo by Anastassia Anufrieva on Unsplash
Ask a room of managers about “meeting KPIs” and you’ll get two different conversations. Half of them are asking how to measure the meetings themselves: do they start on time, is anything getting done afterward, are they worth the payroll hours in the room? The other half want business numbers, things like pipeline coverage or ticket volume, reviewed inside a recurring meeting where the people who own them are sitting.
You need both, and they feed each other. Reviewing numbers in a well-run meeting speeds up decisions, and once you’re measuring the meetings too, you can see which ones deserve to survive. This guide covers both halves: first the metrics that tell you whether your meetings are working, then how to run a KPI review inside the meetings you keep.
The KPIs that measure your meetings
Meeting culture starts improving the day someone can point at a number and say “this got worse in March.” The metrics below are cheap to capture, hard to argue with, and the baseline question is the same for each: is this month better than last month?
On-time start rate
The percentage of meetings that begin within a couple of minutes of their scheduled start. Late starts compound: six people waiting five minutes is half an hour of salary spent on small talk, and the person who arrived on time learns to stop doing that. If your recurring meetings drift late, the fix is usually starting the clock at the scheduled time regardless of who’s in the room, and letting latecomers catch up from the notes.
On-time finish rate
The percentage of meetings that end at or before their scheduled end. This is the single best proxy for whether an agenda is real or decorative. For a benchmark: across 190,000+ meetings run with a timed agenda in Less Meeting, 72% finished on time or early. The lever is per-topic time limits, because a meeting can only run over when nobody can see which topic is eating the budget.
Planned vs. actual duration
The gap between how long meetings are scheduled for and how long they actually run. Among those same timed meetings, the median 40-minute meeting came in around 35 minutes, roughly 13% shorter than planned. Track the median rather than the average, since one meeting where somebody forgot to stop the clock will wreck a mean.
Action item completion rate
The share of action items that get closed, and how many close by their due date. This is the metric that says whether your meetings produce work or just describe it. Across Less Meeting’s history, 84.5% of action items get closed, and the mechanism doing the heavy lifting is carry-forward: an open item resurfaces at every occurrence of the recurring meeting until someone closes it. If your completion rate is low, start with how you follow up on action items before you blame the people.
Cost per meeting
Attendees × duration × a loaded hourly rate. Nobody budgets for meetings, so the number tends to surprise people: a weekly one-hour meeting with eight mid-level attendees runs well into five figures a year. Run your own numbers with the free Meeting Cost Calculator, and if you want the full math, here’s how to calculate what a recurring meeting costs. The total is only useful next to what the meeting produces, so put the two side by side.
Attendee ratings
The human check on everything above. A meeting can start on time, end early, and still be useless, so ask the people in it. A quick efficiency rating at the end of each meeting, ideally anonymous, catches the meetings that look healthy on paper and aren’t.
Setting targets for these numbers
Don’t import anyone else’s targets, including ours. Measure for a month to get a baseline, then set thresholds where your pain is. Reasonable starting points: 90% of meetings starting within two minutes, 70% finishing on time (achievable with timed agendas, per the benchmark above), and 80% of action items closed. Then move each target only after you’ve held it for a quarter.
Reviewing business KPIs inside the meeting
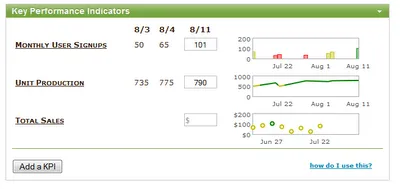
Now the other half. Your team’s health metrics probably live in a spreadsheet or a dashboard somewhere. The case for attaching them to the recurring meeting where they’re discussed is simple:
- The numbers are in the room. Trends and problem areas are projected during the meeting and captured in the minutes that go out afterward, instead of living in a tab nobody opened.
- Off-target numbers get an owner immediately. When a metric goes red while everyone responsible is looking at it, “someone should look into that” turns into an action item with a name on it.
- One place. Metrics, decisions, notes, and action items all live with the meeting, so next week’s occurrence starts from what last week’s numbers said.
Keep the setup lightweight
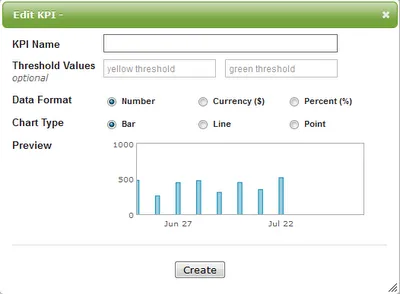
KPIs come with a lot of methodology baggage: goals, milestones, target lines, statistical process control. For a meeting review you need something readable in a few seconds:
- Name — what are you tracking?
- Thresholds — when should it show red, yellow, or green? (Optional. A plain trend line works too.)
- Chart type — bar, line, or point.
- Data type — format the value as $, %, or a plain number.
KPIs make the most sense attached to recurring meetings. Each occurrence gets its latest data point, and the trend builds across every occurrence of the series, so the chart answers “better or worse than last week?” before anyone says a word.
Which KPIs belong in which meeting
The right numbers depend on what the meeting exists to protect. Some patterns that work:
The weekly leadership meeting: the strongest case for an in-meeting scorecard. Open on revenue vs. plan, costs, pipeline coverage, hiring progress, and one or two operational health numbers. The whole point of a leadership meeting that opens on a scorecard is that off-target numbers become owned action items before the meeting moves on. For the full agenda around the scorecard, see how to run a weekly leadership team meeting.
Sales 1:1s and pipeline reviews: one chart per rep (quota attainment, pipeline coverage, activity) trended across every 1:1, so the conversation starts from the trend instead of the most recent anecdote.
Project status meetings: milestones hit vs. planned, open blockers, and budget or burn. A blocker count that climbs three weeks running tells you something you’d never get from a status update.
Support and ops reviews: tickets logged vs. resolved, first-response time, and outages. These are the numbers that drift until a customer notices first.
A rule of thumb on volume: three to seven numbers per meeting. Past that, the KPI review stops being the opening segment and becomes the whole meeting.
Keeping the KPI review short
The failure mode of in-meeting KPIs is a 60-minute meeting where 40 minutes go to narrating charts. Four habits prevent it:
- Put the review in the first five minutes of the agenda, with its own time limit.
- Triage by color: glance at green, spend the discussion on yellow and red.
- Every off-target number leaves the meeting as an action item with one owner, carried forward to the next occurrence until it’s closed.
- Update data points before the meeting, not during it. Live data entry is how five minutes becomes twenty.
Frequently asked questions
What are meeting KPIs?
The term covers two things: metrics that measure the meetings themselves (start and finish rates, action item completion, cost), and business metrics a team reviews inside a recurring meeting (revenue, pipeline, tickets). A healthy team tracks the first and reviews the second.
How do you measure meeting effectiveness?
Combine mechanical metrics with human ones. On-time start and finish rates, planned vs. actual duration, and action item completion tell you whether the meeting is structurally sound; attendee ratings tell you whether it was worth attending. No single number does the job alone.
How many KPIs should one meeting review?
Three to seven. Fewer and the review isn’t worth its agenda slot; more and it crowds out the discussion the numbers were supposed to start.
What’s a good on-time finish target?
Baseline yourself first, but 70% is a realistic target once agendas carry per-topic time limits. Across 190,000+ timed meetings in Less Meeting, 72% finished on time or early, so the target is demanding without being fantasy.
Do all meetings need KPIs?
No. KPI reviews earn their place in recurring meetings tied to a part of the business: leadership meetings, sales 1:1s, project status, ops reviews. A one-off brainstorm or a decision meeting doesn’t need a scorecard.
Less Meeting handles both halves of this. On the measurement side, every meeting gets an automatic score for agenda, timing, and follow-through, and team analytics roll up meeting time and cost across the team. For the review, attach a KPI chart with thresholds to any recurring meeting or 1:1. When a number goes off target, make it an action item with an owner; it carries forward until someone closes it. See how the features fit together, or get started free for 14 days, no credit card required.